Written by AccuScore Staff
Follow @AccuScore on Twitter

2019 Baseball Season Futures - Win Totals & Picks

The 2019 MLB season is starting, which means the marathon season is upon us. That also means this is the best time to take a look at AccuScore's total win projections and compare them against Vegas win totals lines to find value. AccuScore's projections will adjust as the season progresses and you can always see adjusted win-loss projections at the bottom of the Expert Baseball Picks page.

So, without further delay, here are AccuScore's baseball season win projections side-by-side with Las Vegas win totals lines.

MLB - 2019 Baseball Win Totals Odds

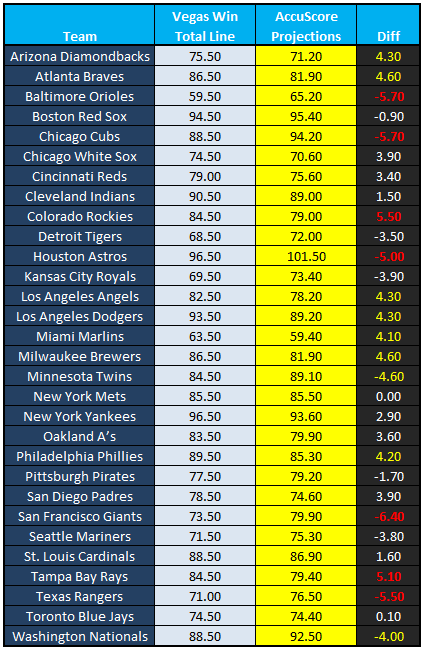
As you can see, there are a number of teams where AccuScore and Vegas disagree on projections, and we've put the ones that are off by 5.0 games or more in red and the ones that have a difference of 4.0 games or more in yellow. Notably, the win total lines for the Toronto Blue Jays and New York Mets are just about identical for both Vegas and AccuScore.

On the opposite end, the greatest value comes via the San Francisco Giants. Vegas has set a line of 73.5 wins. AccuScore projects the Giants will win 79.9 games, which means there's a 6.4 game discrepancy. Only five teams have worse win total lines to start the season, and the odds of the Giants outperforming the low line are pretty good according to AccuScore.

AccuScore has every Opening Day game projection live with Expert Baseball Picks for every game!

Not a member? Use code MLB20 and get 20% off an All Sports monthly or annual membership for a limited time (Note: Free 7-day trial available for first time members): Join AccuScore Today!

Baseball Futures Expert Picks: 2019

1. San Francisco Giants: OVER 73.5: The Giants are simply projected to win far more games according to AccuScore, and this is the greatest value pick on the board.

2.Tampa Bay Rays: UNDER 84.5: The Red Sox and the Yankees are stacked, and both teams are projected to win over 90 games. Add in that the Orioles are projected to win 65 games, according to AccuScore, and there just aren't all that many wins left for the Rays in the AL East. It'll be an interesting fight, but there are a lot of good reasons to pick the Under here.

3.Kansas City Royals: OVER 69.5:OK, the Royal are not projected to be good, but even the slightest of good runs and the Royals pay off big time. In this case, the Royals only need to get to 70 wins to pay off, and AccuScore projects a robust 73.4 wins. Take the Royals Over.

MLB PREDICTIONS

More Articles
MLB
Totals Pick

  Under N/A

100.0%
Spread Pick

 CLE 0

58.4%
41.6%
41.6%
58.4%
58.4%
Side Value
CLE  1.1%

Money Line
CLE  58.4%


Locked Content!
Please login for additional information

Locked Content!
Please login for additional information

Locked Content!
Please login for additional information

Locked Content!
Please login for additional information

Locked Content!
Please login for additional information

Locked Content!
Please login for additional information

Locked Content!
Please login for additional information

Locked Content!
Please login for additional information

Locked Content!
Please login for additional information

Locked Content!
Please login for additional information

Locked Content!
Please login for additional information

Locked Content!
Please login for additional information

Locked Content!
Please login for additional information

Locked Content!
Please login for additional information
MLB
MLB - Top Free Betting Trends
TREND RECORD UNITS
MLB: INTERLEAGUE GAME SV (Season) 49-33, 59.8% 945
MLB: SV-Home Wins 65% or More (Past 7 Days) 16-2, 88.9% 611
MLB: SV-Home Line is -130 to -149 (Season) 28-20, 58.3% 569
MLB: 2 STAR SV Past 7 Days 31-19, 62% 529
MLB: SV-Home Line is -170 or Less (Past 7 Days) 15-5, 75% 478
MLB: SIDE VALUE (Past 7 Days) 52-40, 56.5% 417
MLB: SV-Home Wins < 45% (Past 7 Days) 11-5, 68.8% 368
MLB: AL CENTRAL DIV GAME SV (Season) 17-9, 65.4% 355
MLB: AL GAME SV (Past 7 Days) 20-13, 60.6% 318
MLB: SV-Home Line is +110 to +129 (Past 7 Days) 5-2, 71.4% 309
TREND RECORD UNITS
MLB: OU-Betting Line of 8 TO 8.5 (Season) 91-74, 55.2% 960
MLB: TOTALS (Season) 156-137, 53.2% 530
MLB: AL CENTRAL DIV GAME O/U (Past 7 Days) 6-1, 85.7% 490
MLB: INTERLEAGUE GAME O/U (Season) 40-33, 54.8% 370
MLB: 4 STAR O/U Past 7 Days 19-14, 57.6% 360
MLB: NL CENTRAL DIV GAME O/U (Past 7 Days) 3-1, 75% 190
MLB: OU-Betting Line of 10 TO 10.5 (Past 7 Days) 3-1, 75% 190
MLB: OU-Picking Under (Past 7 Days) 40-35, 53.3% 150
TREND RECORD UNITS
MLB: ML-Home Wins 65% or More (Past 7 Days) 16-2, 88.9% 611
MLB: ML-Home Wins < 45% (Past 7 Days) 12-4, 75% 525
MLB: ML-Home Line is +110 to +129 (Past 7 Days) 6-1, 85.7% 417
MLB: ML-Home Line is -170 or Less (Past 7 Days) 16-4, 80% 367
MLB: INTERLEAGUE GAME ML (Season) 49-33, 59.8% 350
MLB: ML-Home Wins 55 to 59.9% (Season) 45-29, 60.8% 347
MLB: ML-Home Wins 45 to 49.9% (Season) 27-21, 56.2% 298
MLB: 2 STAR ML Past 7 Days 34-23, 59.6% 295
MLB: NL WEST DIV GAME ML (Past 7 Days) 4-1, 80% 220
MLB: NL GAME ML (Past 7 Days) 20-12, 62.5% 216
MLB: MONEY LINE (Past 7 Days) 55-37, 59.8% 203
MLB: AL CENTRAL DIV GAME ML (Past 7 Days) 5-2, 71.4% 128

No data available

Joomla SEF URLs by Artio

MLB Season Futures

AL SEASON-TO-DATE FORECAST POSTSEASON
WIN LOSS WIN LOSS WIN DIV PLAYOFF
Central
Detroit Tigers 13 10 89.7 72.3 63.72% 79.17%
Minnesota Twins 8 13 83.0 79.0 18.35% 41.12%
Kansas City 13 10 81.0 81.0 12.96% 29.14%
Chicago White Sox 3 19 76.8 85.2 4.55% 12.88%
Cleveland 16 6 70.5 91.5 0.39% 1.44%
East
New York Yankees 15 8 93.5 68.5 70.05% 89.82%
Baltimore Orioles 16 6 85.4 76.6 16.31% 54.43%
Tampa Bay Rays 12 12 81.4 80.6 6.19% 30.53%
Boston Red Sox 13 10 80.1 81.9 4.5% 23.93%
Toronto Blue Jays 13 10 78.4 83.6 2.85% 16.02%
West
Texas Rangers 12 11 95.9 66.1 96.07% 97.69%
Los Angeles 8 15 75.7 86.3 1.79% 8.93%
Houston Astros 7 16 75.3 86.7 0.88% 6.52%
Oakland Athletics 9 14 73.9 88.1 0.77% 4.29%
Seattle Mariners 11 11 72.4 89.7 0.48% 2.59%

NL SEASON-TO-DATE FORECAST POSTSEASON
WIN LOSS WIN LOSS WIN DIV PLAYOFF
Central
St. Louis 10 13 91.6 70.4 60.72% 80.8%
Pittsburgh 12 11 84.6 77.4 16.6% 42.1%
Milwaukee Brewers 14 7 82.2 79.8 9.67% 27.65%
Cincinnati Reds 12 10 82.2 79.8 9.92% 27.97%
Chicago Cubs 13 9 77.8 84.2 3.02% 11.14%
East
Philadelphia 16 7 97.2 64.8 77.07% 95.04%
Atlanta Braves 14 7 89.2 72.8 19.37% 69.11%
Washington 10 11 79.6 82.4 2.37% 16.76%
New York Mets 12 10 77.3 84.7 1.1% 9.41%
Miami Marlins 6 18 70.2 91.8 0.05% 0.81%
West
Los Angeles 13 11 88.7 73.3 75.11% 79.72%
San Francisco 11 13 79.4 82.6 14.13% 21.58%
San Diego Padres 13 12 77.5 84.5 8.14% 13.17%
Arizona 11 13 71.8 90.2 1.95% 2.84%
Colorado Rockies 5 18 67.9 94.1 0.59% 0.79%

AL, Central

SEASON-TO-DATE    WIN     LOSS   |   FORECAST    WIN     LOSS   

AL, Central

POSTSEASON    WIN DIV     PLAYOFF

AL, East

SEASON-TO-DATE    WIN     LOSS   |   FORECAST    WIN     LOSS   

AL, East

POSTSEASON    WIN DIV     PLAYOFF

AL, West

SEASON-TO-DATE    WIN     LOSS   |   FORECAST    WIN     LOSS   

AL, West

POSTSEASON    WIN DIV     PLAYOFF

NL, Central

SEASON-TO-DATE    WIN     LOSS   |   FORECAST    WIN     LOSS   

NL, Central

POSTSEASON    WIN DIV     PLAYOFF

NL, East

SEASON-TO-DATE    WIN     LOSS   |   FORECAST    WIN     LOSS   

NL, East

POSTSEASON    WIN DIV     PLAYOFF

NL, West

SEASON-TO-DATE    WIN     LOSS   |   FORECAST    WIN     LOSS   

NL, West

POSTSEASON    WIN DIV     PLAYOFF

MLB Daily Fantasy


Locked Content!
Please login for additional information

MLB Player performance projection


Locked Content!
Please login for additional information